root@localhost:~# status: 31 mcp tools loaded, debugger attached
An AI agent just rewrote your handler. The diff looks fine. Does the code actually work? Tracegrab sets real breakpoints in your real process, fires a real request, and hands the agent back a diagnosis — not a stack trace it has to guess from.
$ auto_debug --scenario checkout.flow.json → breakpoints set: 3 calls fired: 2 paused: 4 times verdict: FAILING — exception thrown on this path ✗ critical DBTimeout thrown in findItem items.repo.ts:9 ⚠ high N+1: findItem called 3× in a loop ⚠ high token cleared (abc123 → '') in getOrders ▲ medium heap +1.0MB, never reclaimed callPath: CONTROLLER getDashboard SERVICE getOrders DB findItem
// the actual problem
An LLM reads your source and reasons about what the code should do. It has no eyes on what the code actually does once a request hits a real DB, a real cache, a real race condition. That gap is where "looks right, ships broken" comes from.
Real breakpoints in vscode.debug, on your actual process. Not a sandboxed re-execution, not a mocked call graph — the live thing, paused mid-flight.
Output is a typed verdict + ranked findings an agent can branch on programmatically. No regex-ing a console dump to find the bug.
31 MCP tools over stdio. No copy-pasting logs back and forth between your terminal and a chat window.
save_trace → ship the fix → compare_traces. The agent proves REGRESSION / CHANGED / EQUIVALENT instead of asserting "should be fixed now."
// mcp://tracegrab
Any MCP client — Cursor, Claude Code, Kiro, your own agent loop — gets the same 31-tool surface. Register once:
{ "mcpServers": { "tracegrab": {
"command": "node",
"args": ["/ABS/PATH/tracegrab/mcp/flow-mcp.mjs"],
"env": { "FLOW_WORKSPACE": "/ABS/PATH/to/target/repo" }
} } }
One call: set breakpoints, drive the scenario, build the call map, run every detector, return a verdict. The whole investigation, one round trip.
Granular control when auto isn't enough: read a live pause, inspect scope, mutate a variable to force a branch, step, continue. Read → decide → act.
No VS Code required. The same steer loop runs in CI, a container, or a pure-agent box. Node always; Python via debugpy.
Baseline a run, diff a later one — REGRESSION / CHANGED / EQUIVALENT — plus behavior contracts an agent (or CI) can gate on.
Structured runtime truth: nested calls, boundary data, heap deltas, variable values, Mermaid export. Something to reason over, not a screenshot.
The agent probes what's possible before committing. Every live mutation is logged. Secrets redacted, propose-then-confirm by default.
Ships with an AGENTS.md the agent reads unprompted — it tells the agent when to reach for this (a bug report, a ticket, "why does endpoint X do Y") and how to turn that into breakpoints + a run. Full spec: docs/AGENT_AUTOMATION.md.
// receipts
Captured from the real built webview — verdict first, evidence around it.
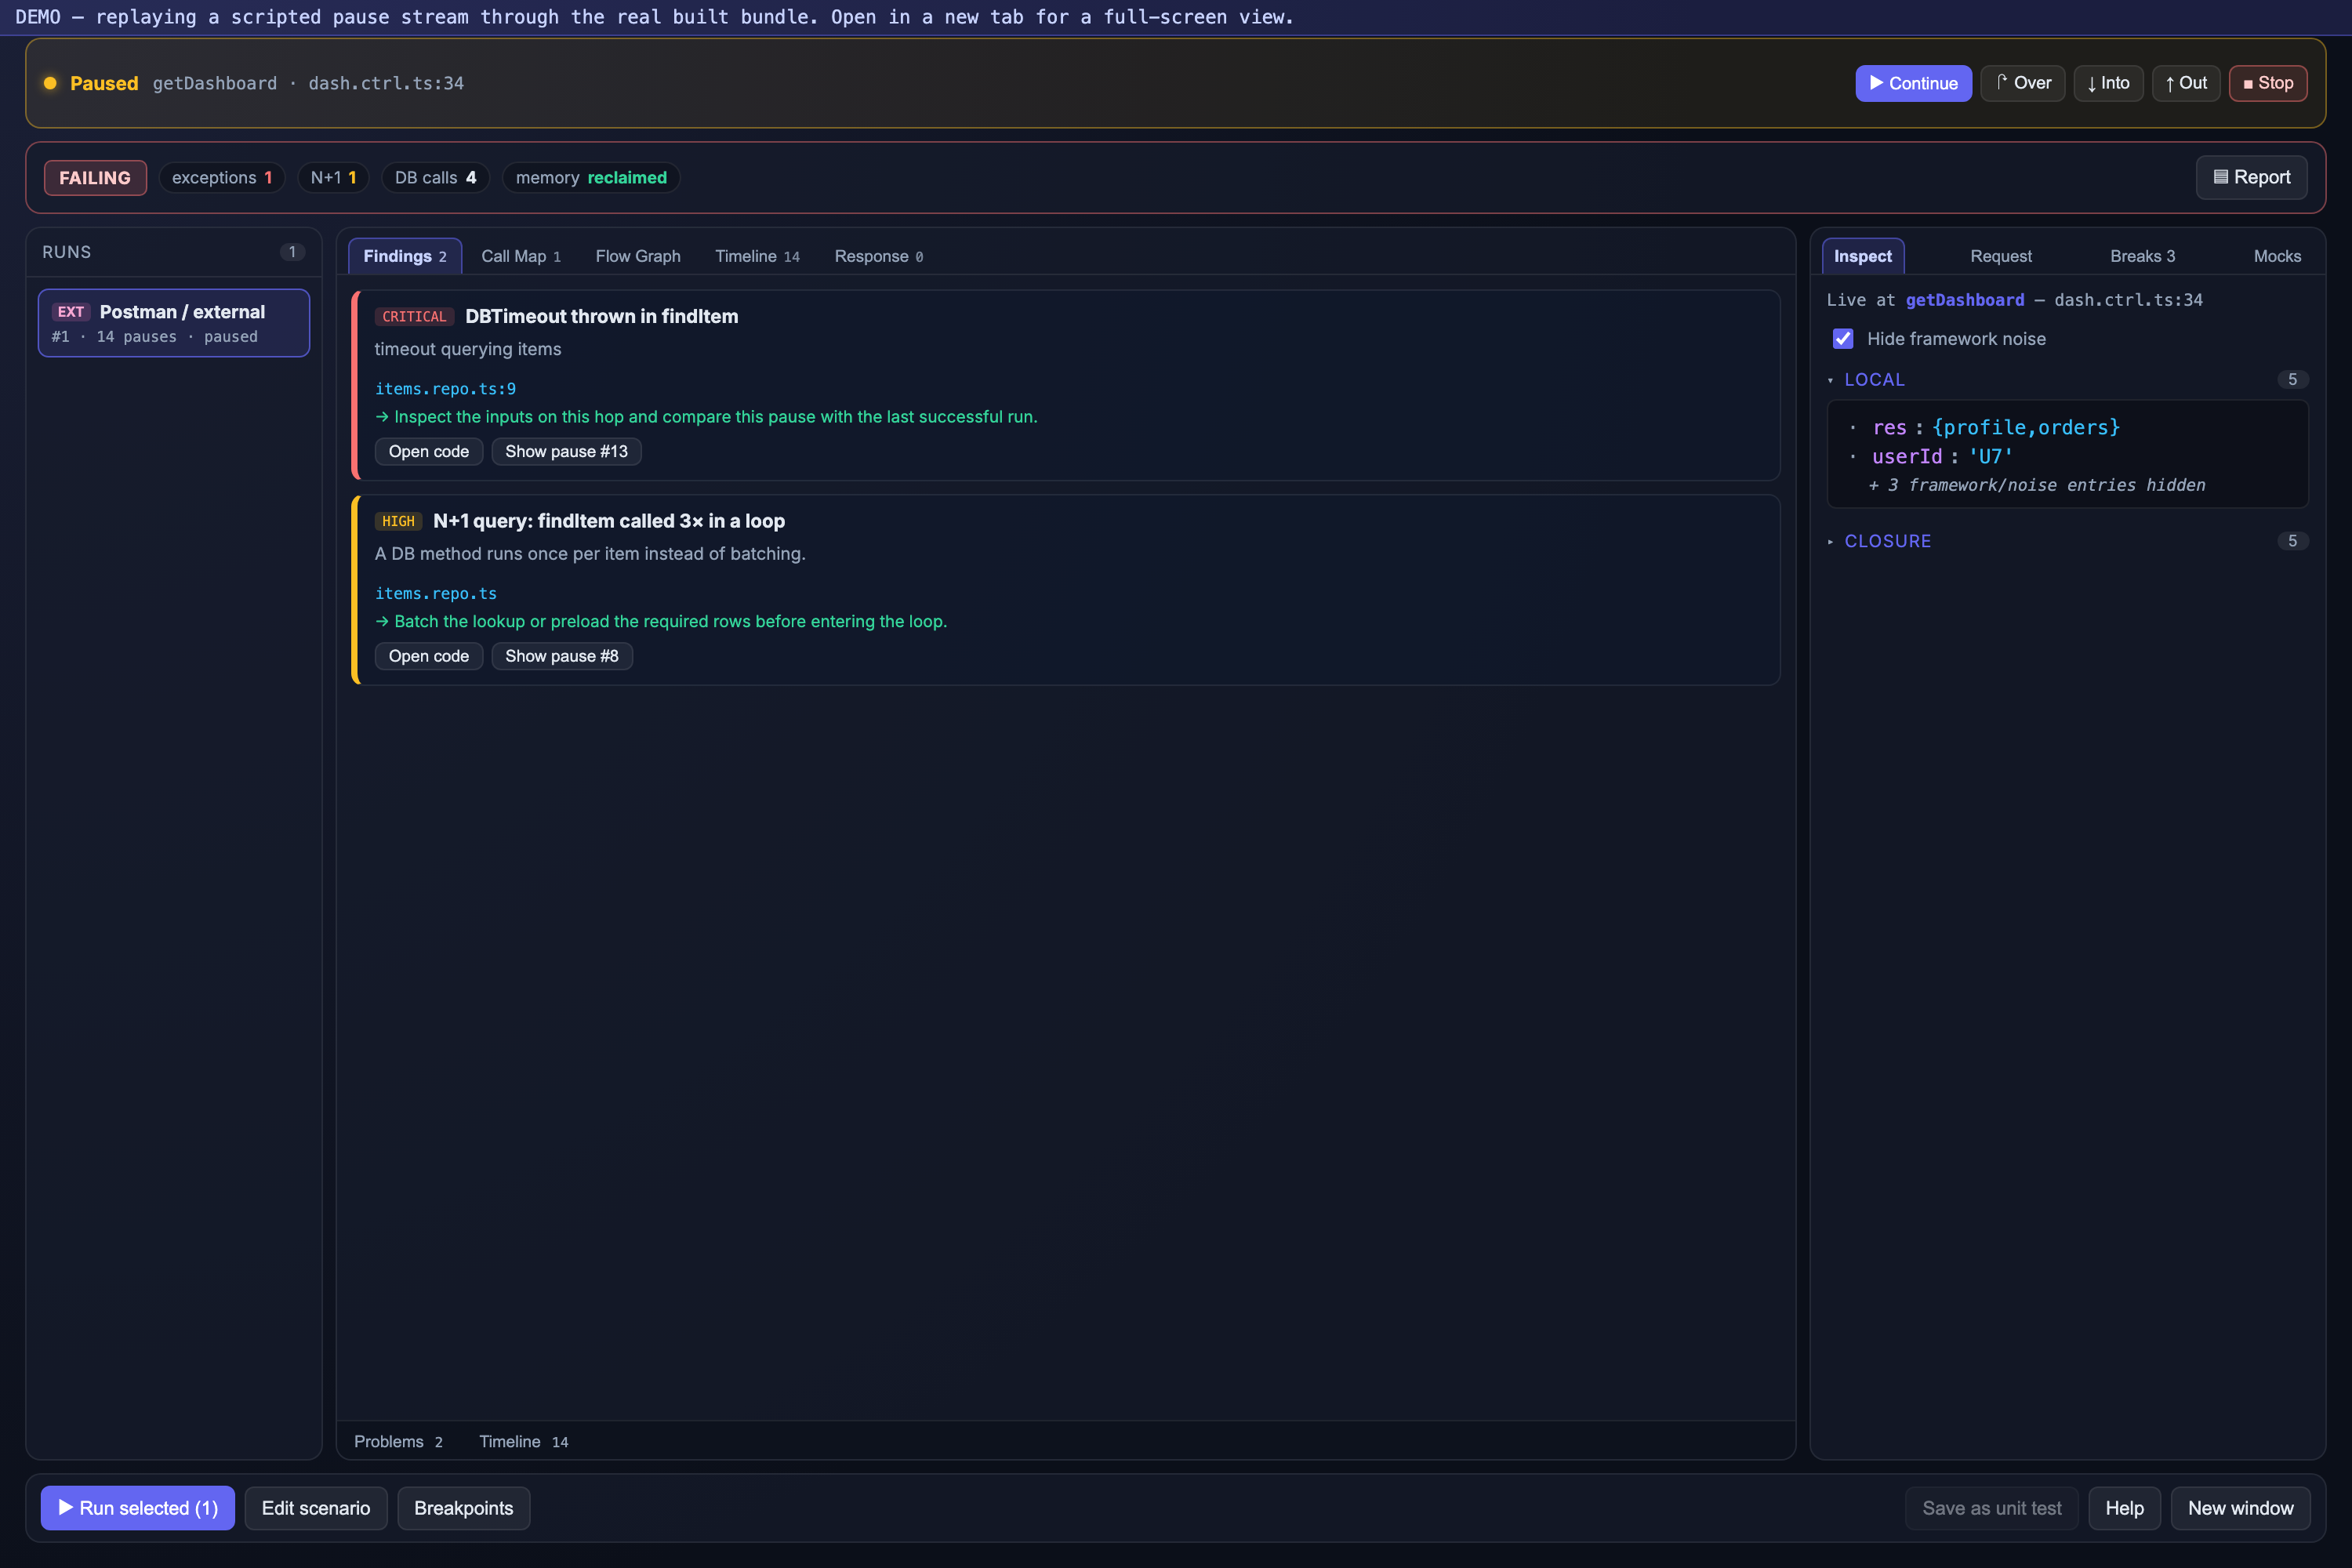
Ranked findings, nested call tree, run history, live inspector — in one view.
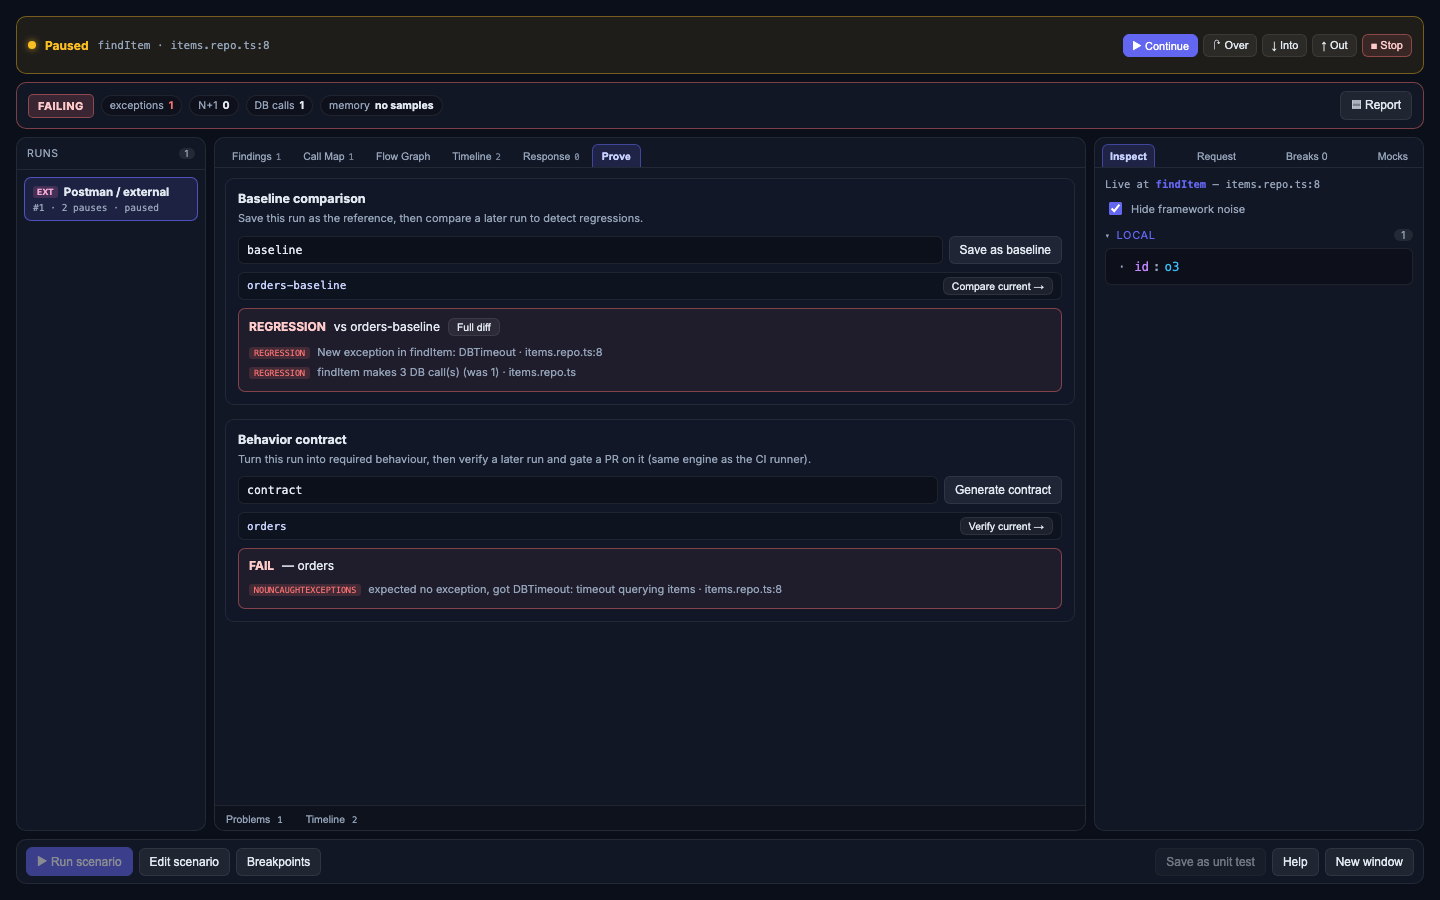
Baseline vs. later run: REGRESSION / CHANGED / EQUIVALENT, plus a contract check.
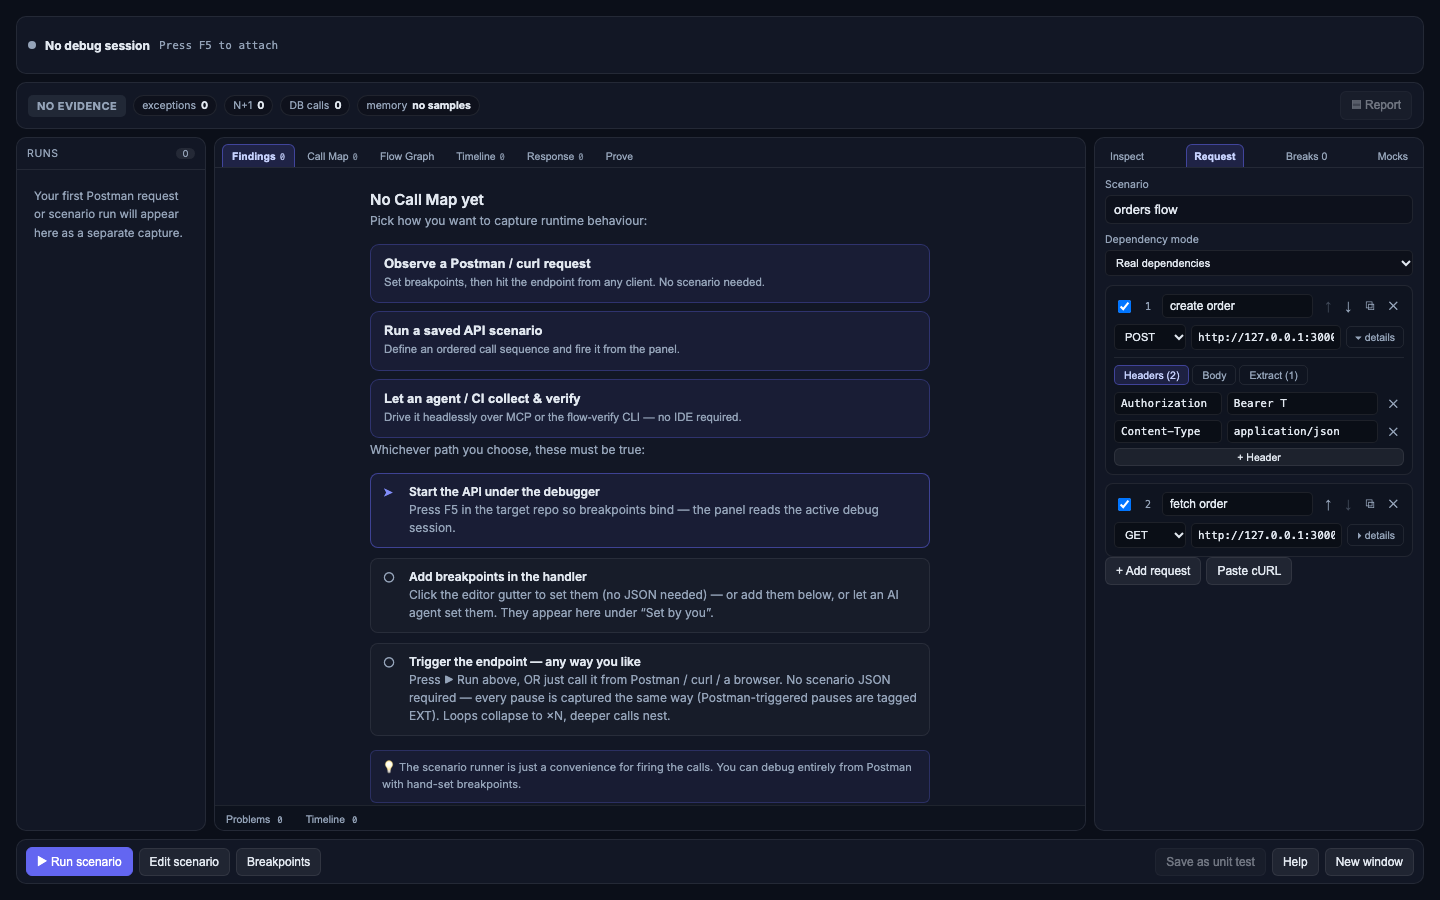
Method, URL, headers, body, response-value extraction. Reorder, duplicate.
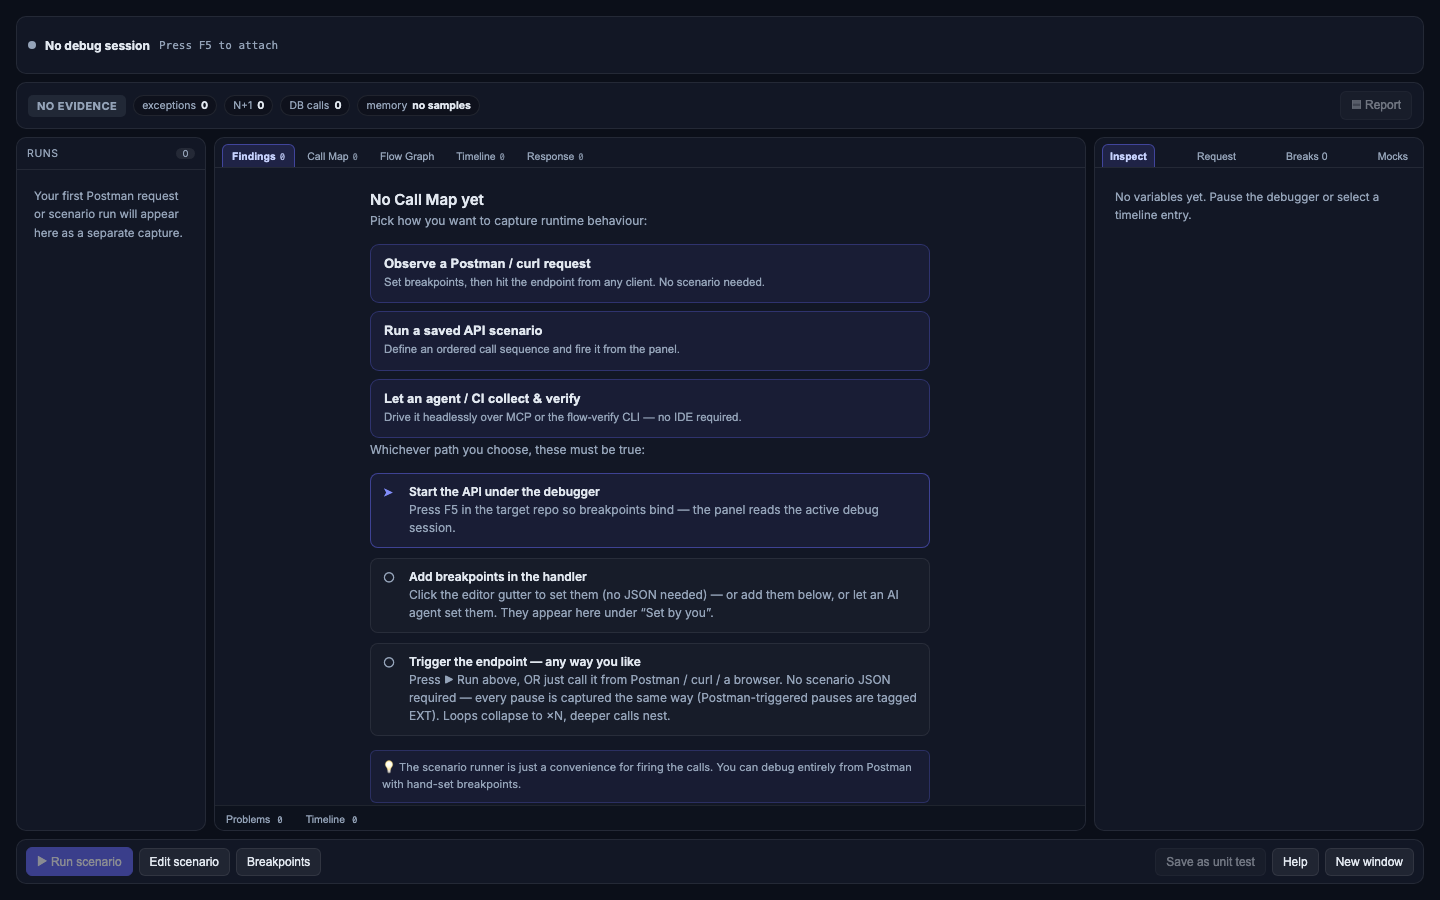
Observe a Postman request, run a scenario, or let an agent/CI collect — your pick.
// not another debugger
| generic dap-over-mcp | tracegrab | |
|---|---|---|
| model | step / inspect / evaluate | request-shaped call map + diagnosis |
| output | raw frames & variables | verdict + ranked findings |
| http flow aware | — | ✓ controller→service→db |
| n+1 / silent-clear / heap | — | ✓ auto-detected |
| mock the db for a run | — | ✓ boundary injection |
| headless (no ide) | — | ✓ ci-safe |
// get running
Not on the VS Code Marketplace yet — the extension ships as a built .vsix
you grab from the repo and install directly. Works in VS Code, Cursor, and Windsurf (all three
read the same .vsix format).
GitHub repo: github.com/sinhaKAN-ra/tracegrab/releases once a release is cut, or build your own .vsix from main with the commands below — same artifact either way.
Node.js 18+, VS Code / Cursor / Windsurf, and the vsce packager (pulled in automatically via npx below — no global install).
$ git clone https://github.com/sinhaKAN-ra/tracegrab && cd tracegrab $ npm install $ npm run build # webview + host $ npx vsce package # → tracegrab-0.0.1.vsix $ code --install-extension tracegrab-0.0.1.vsix # or: cursor --install-extension ...
Already have the .vsix from a release? Skip straight to the last line, or use Extensions panel → ··· → Install from VSIX if you'd rather click than type.
// first run
Three steps from installed extension to a live, agent-readable trace.
start_headless_session() (no F5, works in CI/containers).mcp/flow-mcp.mjs to your agent and let it call auto_debug(). Watch the call map and verdict fill in live.// hack on it
VS Code extension host (src/, Node/TS) + a React webview
(webview-ui/) + a zero-dep MCP server (mcp/). Full map in
CONTRIBUTING.md.
$ git clone https://github.com/sinhaKAN-ra/tracegrab && cd tracegrab $ npm install $ npm run build # webview (Vite) then host (tsc) $ npm test # host-logic + call-tree + safety suites
Gates a PR must pass green:
npm run compile — host TypeScript, 0 errors.npm run build --prefix webview-ui — webview build, 0 errors.cd webview-ui && npx oxlint src — 0 warnings, 0 errors.npm run lint:boundaries — public core stays self-contained and strategy-free.One logical change per PR. Never commit secrets, .vsix artifacts, or .flow-debugger/ runtime output. Found a bug or want to propose a feature? Open an issue, or email nomore.report@gmail.com directly.